

· Protocolzone
A trading decision is really seven decisions. What the data says. Whether anything is worth acting on. Which strategy, and in what order its legs go on. How a change links to the position it modifies. Whether it fits the limits. How the order is placed. How the result is hedged.
Put all seven inside one model prompt and you get an answer you cannot inspect. Split them into separate services and you spend your time on the glue between them. We are building the decision layer of AnkEDGE, our options trading platform, a third way: as a graph of agents on LangGraph, where each agent owns one of those decisions and they share one record of what has been decided.
This article explains what LangGraph is, how the AnkEDGE graph is organised, how the same pattern analyses prediction markets, and where it fits in other enterprises.
What LangGraph is
LangGraph is an open source library, from the team behind LangChain, for building applications as a graph of steps that share a state. It is available for Python and JavaScript. It is not a model and not a trading strategy. It is the control flow that sits around models and code.
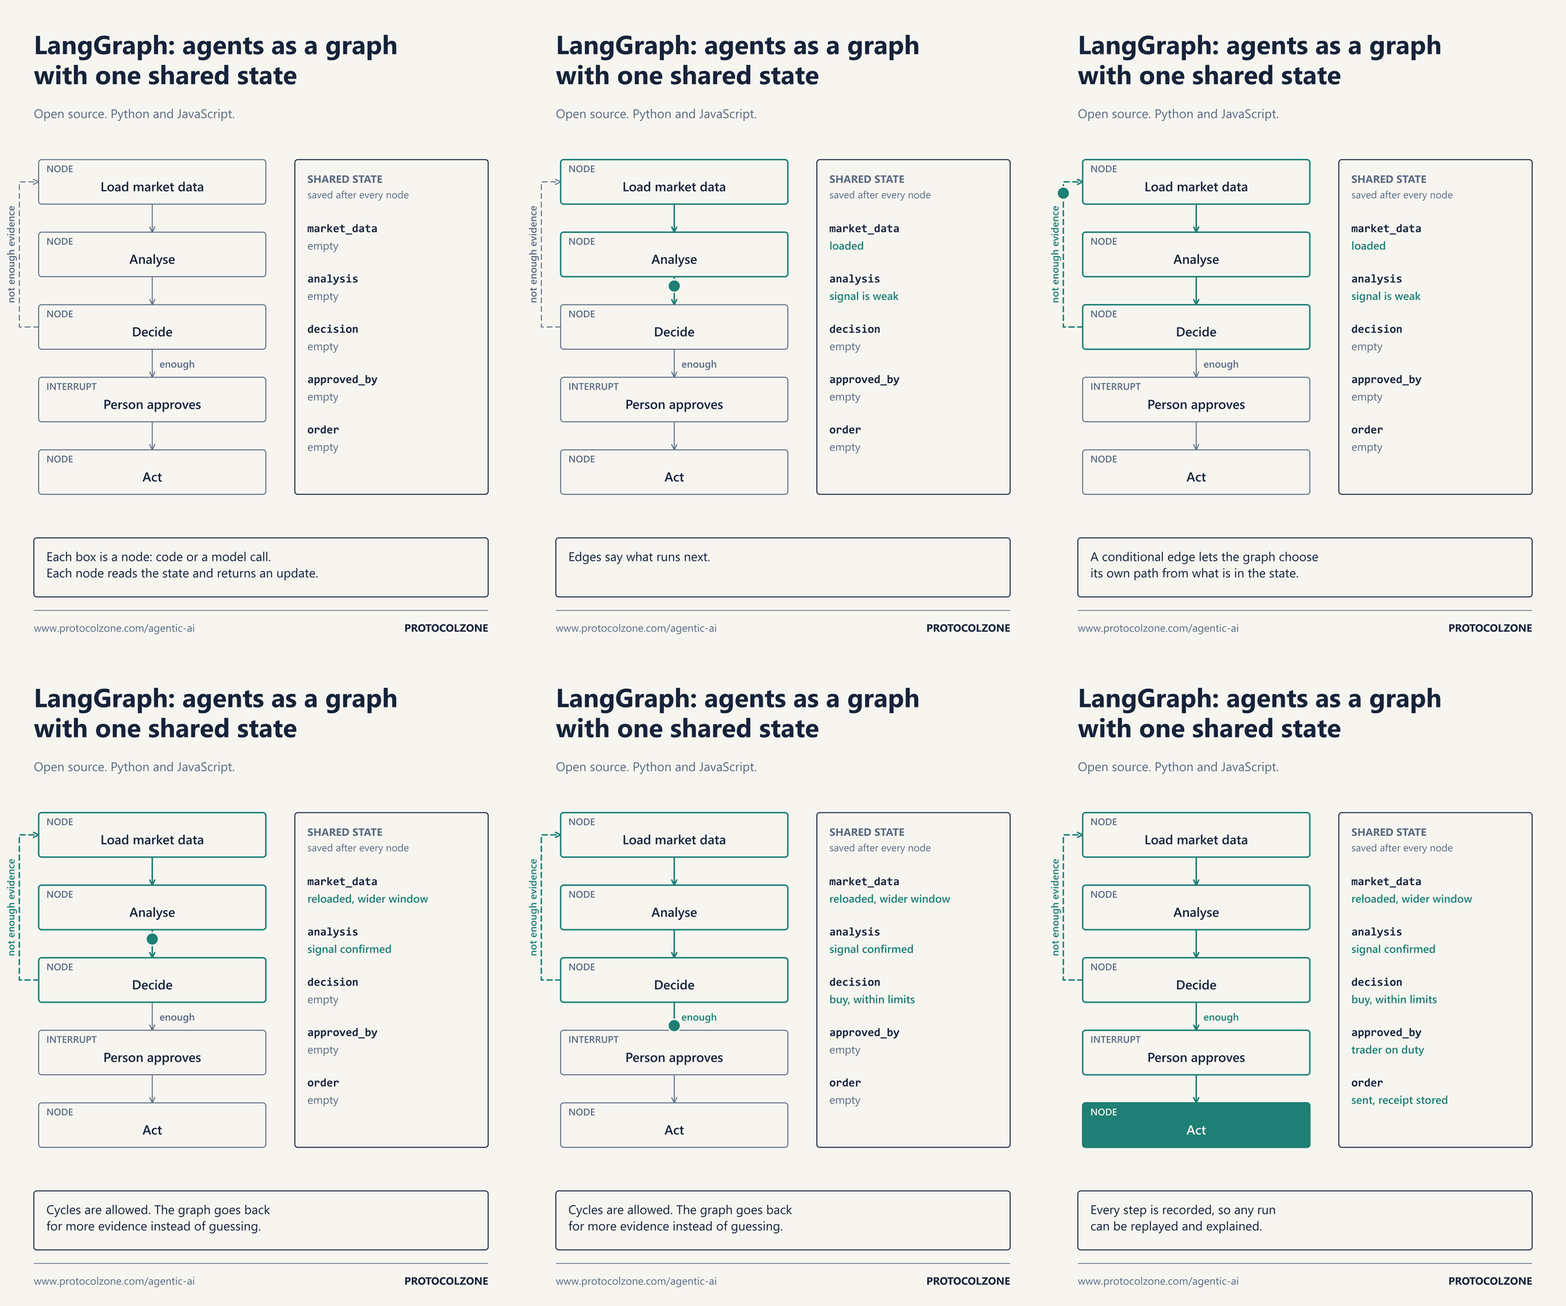
Six ideas carry most of it:
- State. One typed object that every step reads and updates. It holds the data loaded, the analysis, the decision and who approved it. Because there is one state, every decision can be traced to the inputs it saw.
- Nodes. A node is a function that reads the state and returns an update. Some nodes call a language model. Others run a statistical model or plain code. The graph does not care which.
- Edges and conditional edges. Edges decide what runs next. A conditional edge reads the state and picks the path, so the graph can route a weak signal back for more data and a strong one forward to a decision.
- Cycles. Unlike a simple pipeline, a graph can loop. An agent can go back, try again or ask another agent, with a limit on how many times.
- Checkpoints. The state is saved after each step. A run can resume after a failure, be replayed later, or be inspected step by step when someone asks why a decision was made.
- Interrupts. A run can pause and wait for a person, with the state saved, then continue from that point when the person answers. This is how human review becomes part of the graph rather than an email outside it.
LangGraph also streams intermediate results, nests graphs inside graphs, and fans work out to several nodes in parallel and joins the results. Those three matter for the trading and prediction market graphs below.
Why a graph rather than one large agent
A single agent with a long prompt and a set of tools can do impressive things in a demo. In production it has three problems. You cannot test one part of its reasoning in isolation. You cannot put a hard rule in the middle of it. And when it does something wrong, you have one opaque step to investigate.
A graph fixes all three. Each node has one job and its own tests. Rules that must never bend live in nodes that are plain code. Each node can use a different model, or none. And the checkpoint history shows exactly which node produced which part of the decision.
The AnkEDGE graph
AnkEDGE’s decision layer is being built as seven roles, each a node or a small subgraph, sharing one state.
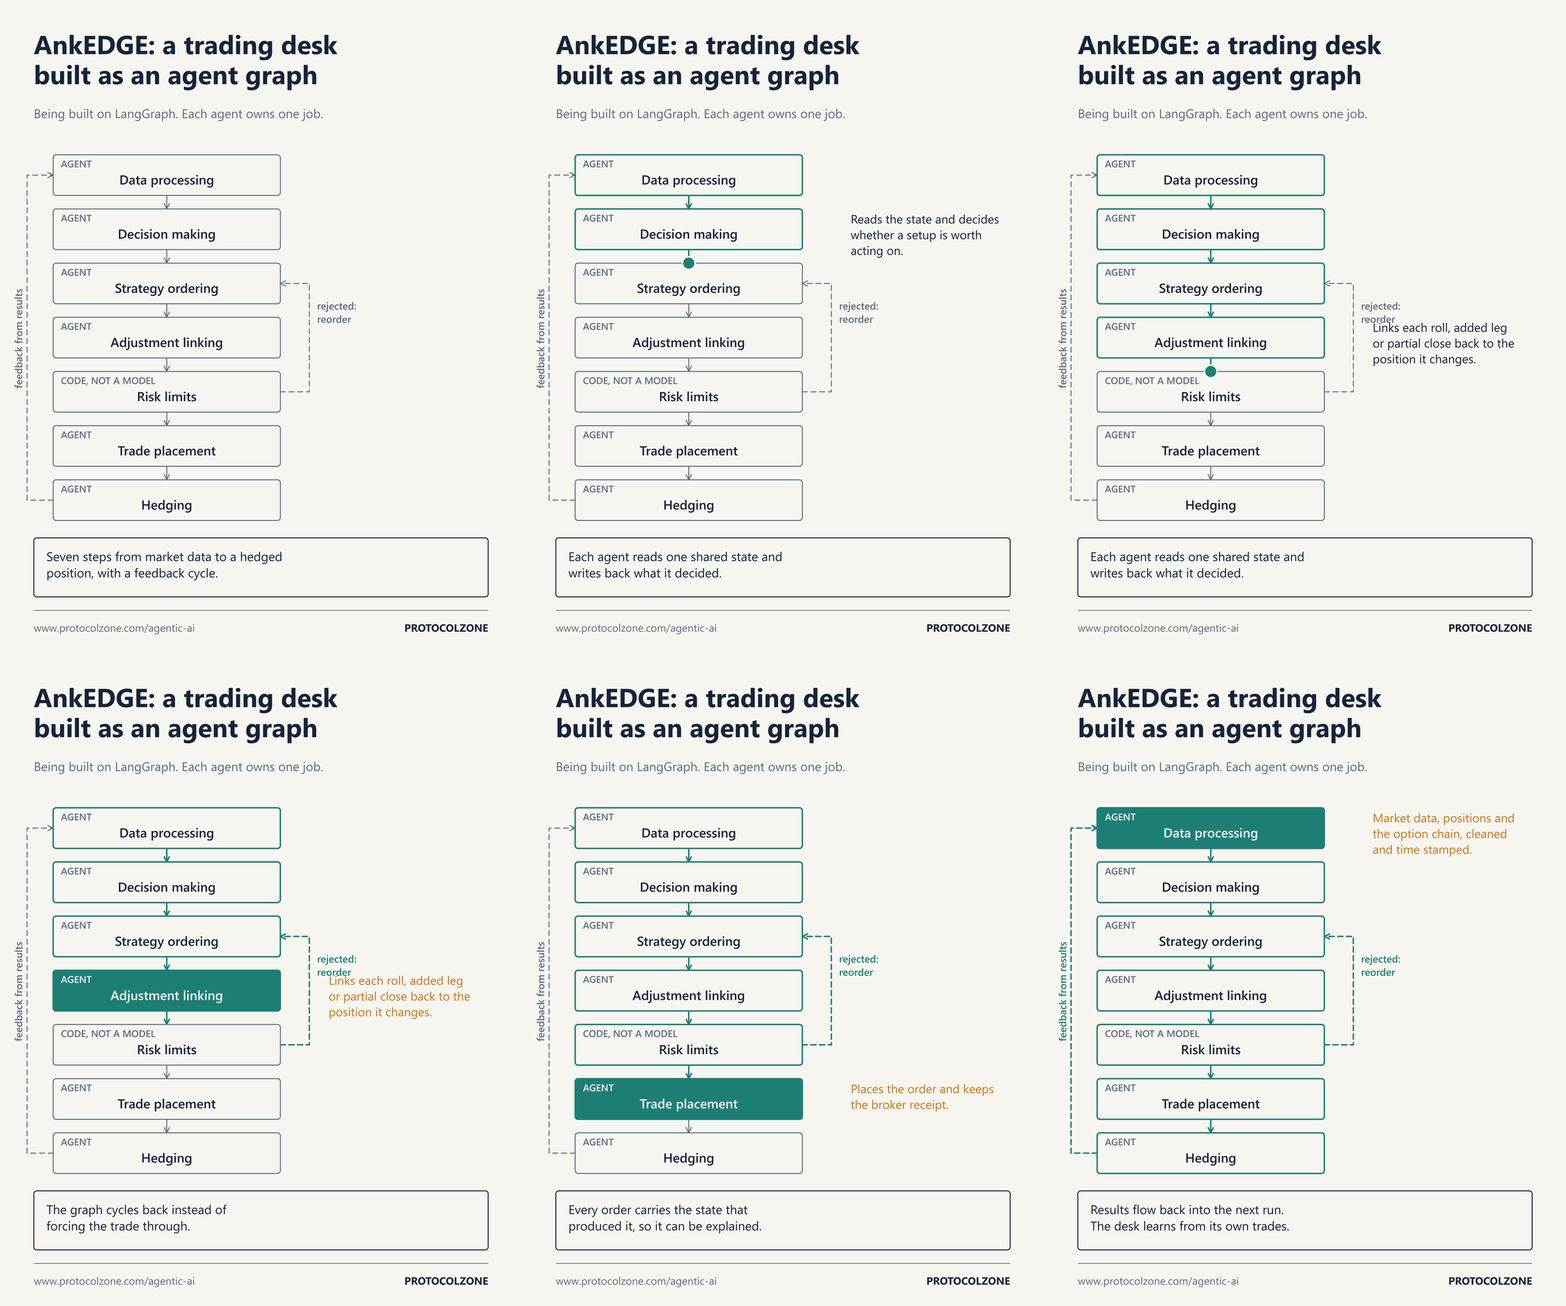
- Data processing. Market data, positions and the option chain, cleaned, time stamped and written to the state. Everything downstream works from this snapshot, not from a live feed that changes under it.
- Decision making. Reads the snapshot and decides whether a setup is worth acting on at all. Most of the time the answer is no, and the run ends there.
- Strategy ordering. Ranks candidate strategies and orders the legs of the chosen one, because the order in which legs are placed changes the risk carried between fills.
- Adjustment linking. Options positions are adjusted: rolled, extended with a leg, partly closed. This agent links each adjustment to the position and the strategy it changes, so the book always shows one position with its history rather than a pile of unrelated trades.
- Risk limits. Plain code, not a model. Position, exposure and loss limits are checked here. A proposal that breaks a limit goes back to strategy ordering. No prompt can talk its way past this node.
- Trade placement. Places the order and records the broker’s response against the state that produced it.
- Hedging. Rebalances the hedge as the position and the market move.
The results of each run, fills, slippage and how the position behaved, are written back and read by the next run. That feedback cycle is the point of building it as a graph: the desk learns from its own trades instead of from a spreadsheet reviewed once a month.
This graph sits on top of engineering AnkEDGE already has: strategy definitions, a decision engine and a historical backtesting service. The agents do not replace backtesting. A strategy still has to pass walk forward replay and a simulation stage before it trades with real money.
What we do not let an agent do
The design rules are as important as the agents.
- No model sets its own limits. Limits live in code, outside any prompt, and are versioned like any other release.
- No order without a key. Every order carries an idempotency key, and an unclear result is reconciled before a retry. We wrote about why in A timeout is not a failed debit.
- Model output is a proposal. It becomes an action only through the graph’s rules or a person’s approval. See AI output needs an approval path.
- Language models stay out of the time-critical path. Placement and hedging run on code and fast models. A language model is useful for reading and reasoning, not for racing the market.
- A kill switch outside the graph. One action stops new orders across the graph, whatever state it is in.
Prediction market analysis
A prediction market prices an event contract, such as whether something will happen by a date. The price reads as the market’s probability. The analytical question is whether that probability is right, and whether any difference survives fees, spread and the risk that the contract resolves in an unexpected way.
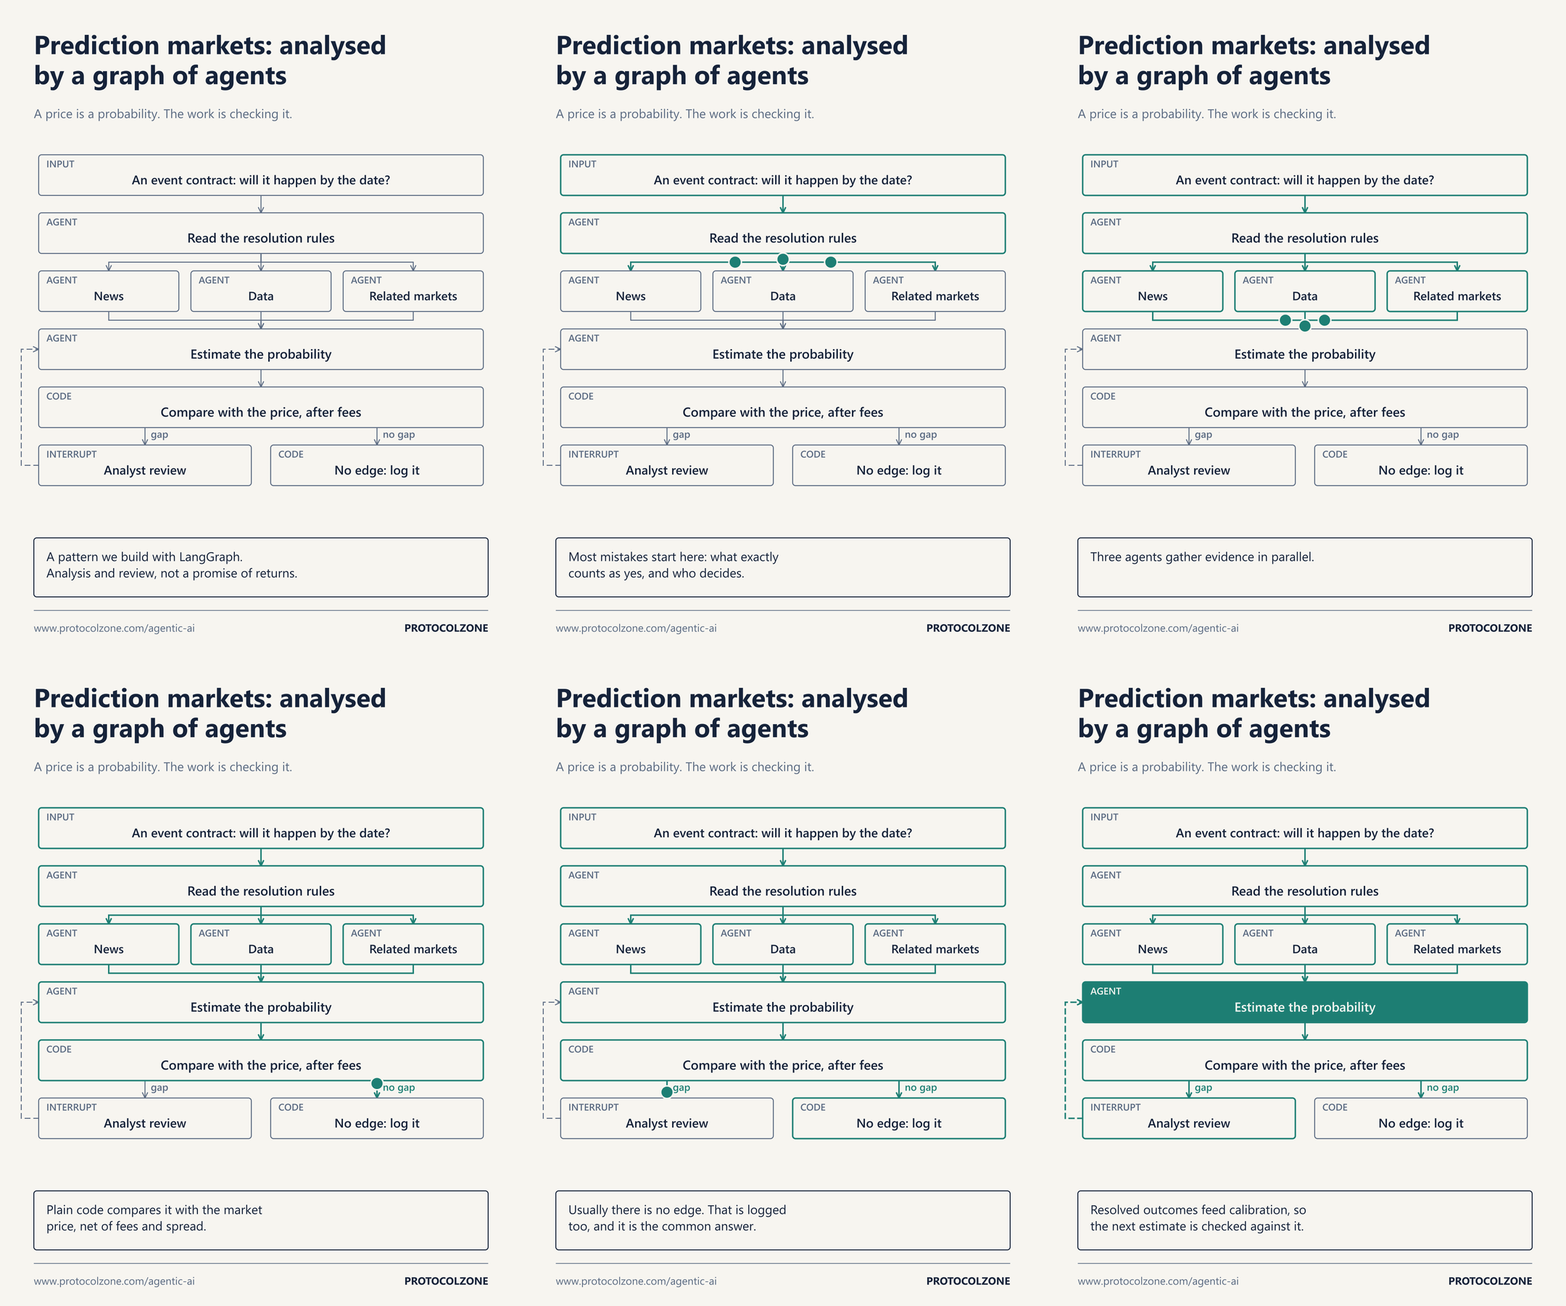
As a graph:
- Read the resolution rules first. What exactly counts as yes, who decides, and by when. Many apparent mispricings are a misreading of the rules.
- Gather evidence in parallel. Separate agents for news, structured data and the prices of related contracts, fanned out and joined in one state.
- Estimate the probability, with reasons. The estimate carries the evidence it used, so a reviewer can disagree with a specific reason rather than a number.
- Compare with the price in code. After fees and spread. Usually there is no edge, and that answer is logged too.
- Review before acting. When there is a gap, the graph pauses for an analyst.
- Calibrate on outcomes. Every resolved contract scores the estimate that preceded it, so the system learns where it is overconfident.
The underlying discipline is one we have practised for years in probability modelling: a good prediction and a good position are two different problems. We covered that in Predicting an outcome and staking on it are two problems. Prediction markets are regulated differently from one jurisdiction to the next, as financial contracts in some and as gambling in others, and any build starts from what the operator or firm is licensed to do.
This is a pattern we build. It is not a delivered prediction market project, and it is not investment advice.
The same graph in other enterprises
The roles are the same everywhere: sense, analyse, decide, check, act, learn. What changes is the agents inside each role.
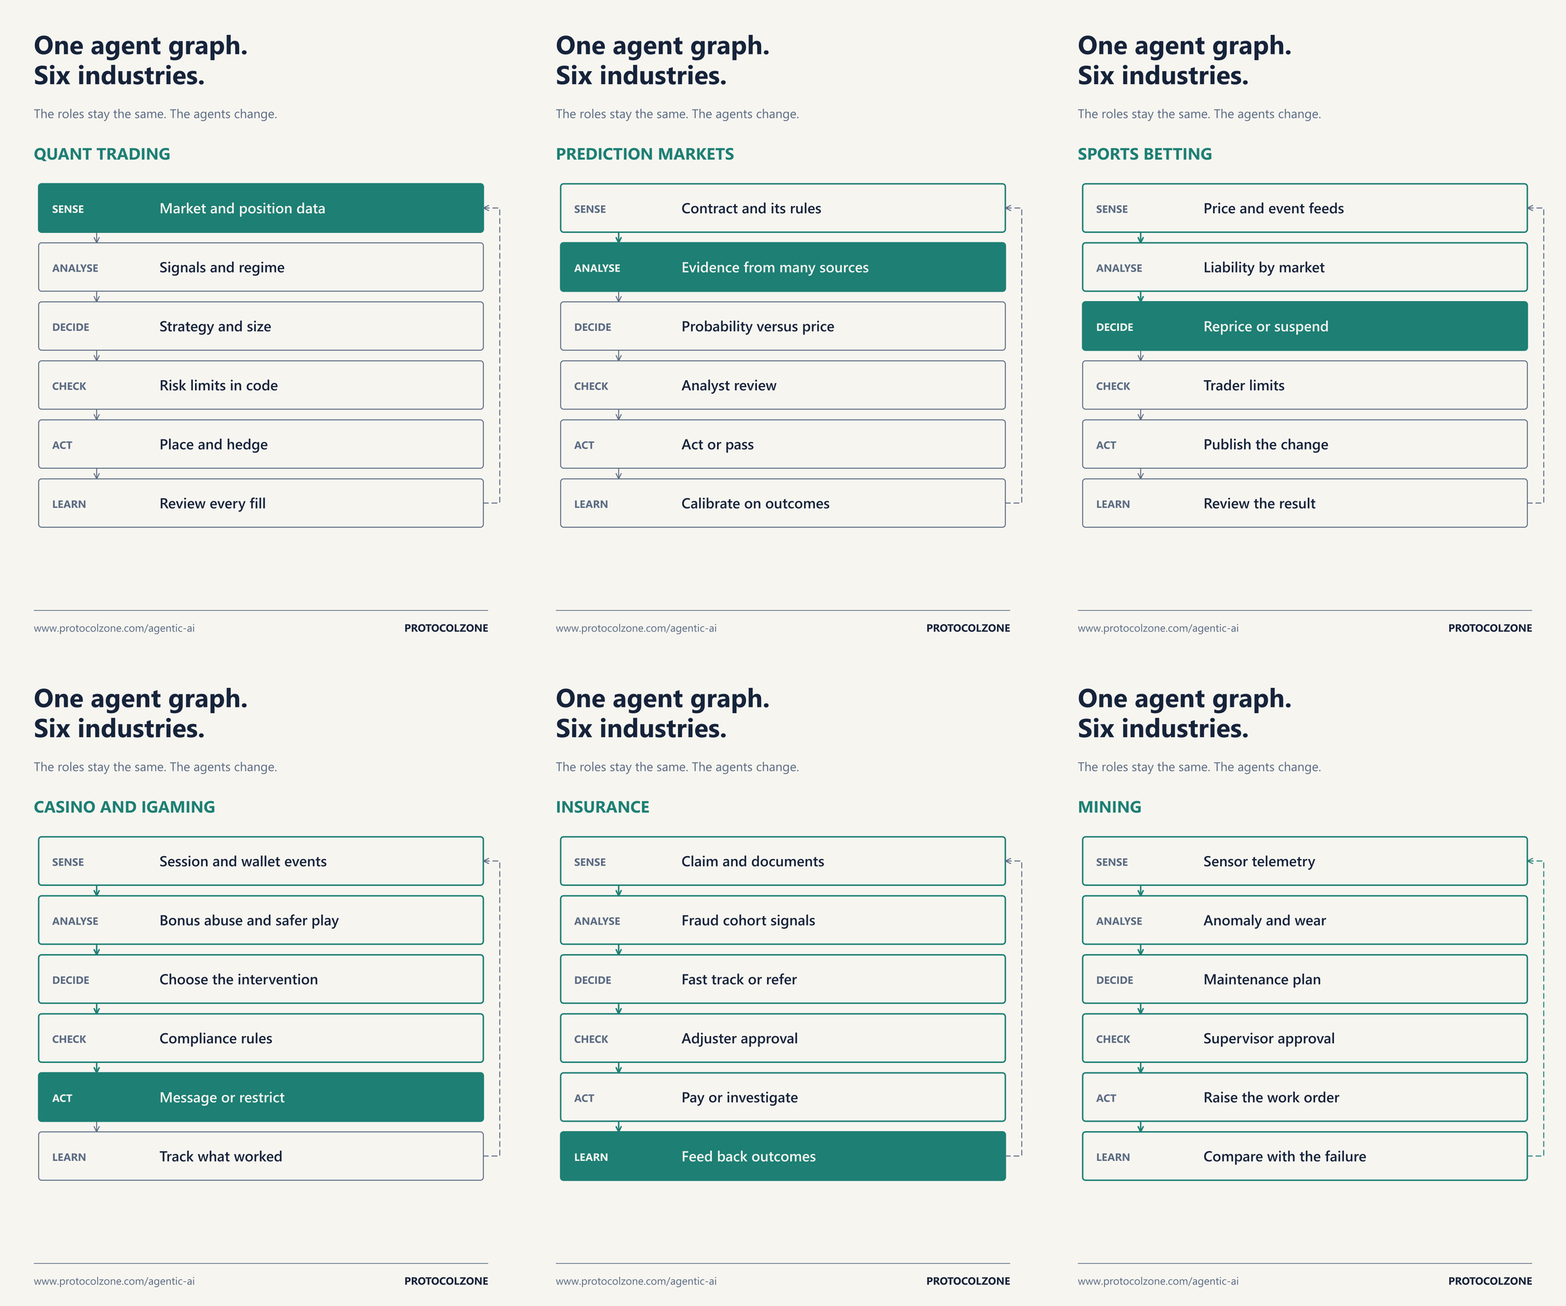
- Sports betting. Price and event feeds in, liability by market analysed, a reprice or suspend proposed, trader limits checked, the change published. The proposal is the agent’s; the limit is the trader’s.
- Casino and iGaming. Session and wallet events read for bonus abuse and safer gambling signals, an intervention chosen, checked against the operator’s compliance rules, then a message or a restriction applied.
- Insurance. A claim and its documents read, fraud cohort signals checked, a fast track or referral proposed, an adjuster approving anything above the rules.
- Mining. Sensor telemetry read for anomalies and wear, a maintenance plan proposed, a supervisor approving the work order, and the result compared with what actually failed.
- Enterprise operations. A fault detected, a ticket opened with the affected customer attached, the customer told first. Our Event Trigger Service already turns live events into actions this way, and it is the natural first node of many graphs.
In each case the value comes from organising data and decisions in one place: one state that holds the evidence, the decision and who approved it.
What it takes
- Data that is ready for agents. Event streams, versioned data and clean APIs. If the data arrives overnight in a spreadsheet, start there. That is the same work as making a platform AI ready.
- One graph, end to end, first. A small graph in production teaches more than a large one in a notebook.
- Tests for every node and a set of past cases for the whole graph. When a model or a prompt changes, run the cases again before release.
- A durable checkpoint store and monitoring. Every run must be inspectable after the fact, by an engineer and by a compliance reviewer.
- The people who own the decisions. The graph encodes their rules. It does not replace them.
Where this stands
AnkEDGE’s agent graph is being built on LangGraph now. The foundations under it are delivered work: probability modelling and backtesting, real-time market data processing, event triggers, and AI output that passes through an approval path. The prediction market graph and the industry graphs above are patterns we build for clients, described as capability, not as finished projects.
If you want to organise trading, pricing or operational decisions as a graph of agents, see Agentic AI and LangGraph or tell us about the decisions you want to automate.
- agentic-ai
- langgraph
- multi-agent-systems
- quant-trading
- prediction-markets
- ai-implementation